Page 79 - Building Journal - June 2015
P. 79
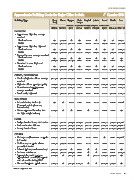
BUILDING COSTS
th
Approximate Building Costs for major Cities in Asia 4 Quarter 2014
Building Type Hong Macau Singapore Kuala Bangkok Jakarta Brunei Manila Seoul
Kong Lumpur
USD / m2 CFA (See also exchange rates per U.S. dollar below)
HK$7.80 MOP 7.99 S$1.36 RM 3.46 BAHT 32.32 IDR 12,750 B$1.36 PHP 44.40 KRW 1,107
DOMESTIC
˙ Apartments, high rise, average
standard
- Shell and core N/A 1,627-2,265 N/A N/A 526-650 N/A N/A N/A 994-1,175^
- Full fit 3,075-3,615 2,090-2,553 1,420-1,605 370-560 681-866 660-754 761-1,044 870-930 1,310-1,626^
˙ Apartments, high rise, high end
- Shell and core N/A 2,265-3,605 N/A N/A 634-866 N/A N/A N/A 1,039-1,238
- Full fit 4,155-4,835 2,904-4,456 2,155-3,225 895-1,070 990-1,176 918-1,037 939-1,223 1,170-1,250 1,626-1,988
˙ Terraced houses, average standard
- Shell and core N/A 2,841-3,542 N/A N/A 309-433 N/A N/A N/A N/A
- Full fit 4,230-4,935 3,567-4,243 1,825-2,045 260-370 495-619 354-459 492-776 630-720 N/A
˙ Detached houses, high end
- Shell and core N/A 3,442-4,956 N/A N/A 557-805 N/A N/A N/A 1,039-1,283
- Full fit 5,575-6,280 4,330-5,645 2,305-3,075 870-1,070 836-1,021 961-1,160 749-1,032 1,300-1,400 2,259-3,433
OFFICE / COMMERCIAL
˙ Medium/high rise offices, average 3,075-3,590* 2,403-3,104 1,825-2,010@ 705-810 650-805# 657-726 761-1,044 840-900 1,220-1,355
standard
˙ High rise offices, prestige quality 3,780-4,615 3,104-3,367 2,010-2,230@ 1,015-1,365 866-1,114## 969-1,082 1,076-1,360 1,260-1,380 1,400-1,671
˙ Out-of-town shopping centre, 3,115-3,655 2,265-3,367 2,010-2,155 625-755 650-851 564-624 738-1,021 750-880 1,129-1,771
average standard
˙ Retail malls, high end 4,100-4,870 3,567-4,255 2,155-2,375 770-1,000 851-913 624-674 973-1,257 1,080-1,150 1,310-2,214
INDUSTRIAL
˙ Industrial units, shell only. N/A N/A 760-980 375-470 511-619 303-328 351-635 460-480 678-858^^
(Conventional single storey
framed units)
˙ Owner operated factories, low 2,370-3,010 N/A N/A 500-560 N/A 329-362 478-761 510-550 N/A
rise, light weight industry
HOTEL
˙ Budget hotels - 3-star, mid market 3,950-4,295 3,204-3,617 2,265-2,450 1,175-1,620 1,176-1,300 1,141-1,347 1,438-1,722 1,190-1,375 1,681-2,123^^^
˙ Business hotels - 4/5-star 4,165-4,935 4,330-5,181 2,890-3,295 2,035-2,350 1,485-1,702 1,559-1,764 2,028-2,312 1,270-1,390 2,358-4,066^^^
˙ Luxury hotels - 5-star 4,870-5,640 5,181-6,308 2,890-3,295 2,260-2,610 1,733-1,857 1,660-1,871 2,082-2,366 1,575-1,650 2,620-4,156^^^
OTHERS
˙ Underground/basement car parks 2,305-2,920 1,902-2,753 975-1,340 420-570 557-743 467-572 N/A 510-560 949-1,084^^^^
(<3 levels)
˙ Multi storey car parks, above 1,435-1,705 1,051-1,364 695-985@@ 245-320 186-309 303-328 390-674 460-510 587-768
ground (<4 levels)
˙ Schools (primary and secondary) 2,540-2,755** 2,090-2,403 N/A 260-295 N/A N/A 571-855 690-765 N/A
˙ Students' residences 2,500-2,910 1,665-1,915 1,680-1,825 330-365 N/A N/A 667-950 690-765 1,419-1,500
˙ Sports clubs, multi purpose 3,845-4,420 N/A 2,085-2,230 680-740 N/A 1,038-1,573 1,535-1,819 1,180-1,425 N/A
sports/leisure centres (dry sports)
with a/c and including FF&E
˙ General hospitals - public sector 5,065-5,770 N/A 2,890-3,040 1,015-1,250 N/A N/A 1,725-2,009 1,350-1,475 N/A
Source: Langdon & Seah
Building Journal 77